A Summary of the Fundamental Analysis Strategy
This is a summary of the fundamental analysis of Malaysia’s stock market strategy presented in the workshop. This strategy applies to all industries as a general rule of thumb. However, each industry may have their own unique analysis which will be covered in “Case Study on Specific Industries based on current situation (Sep 2016)”. This post is the 2nd part of “Fundamental Analysis of Malaysia’s Stocks Market” post (1st post). Please read the 1st post before proceed with this post for better big picture understanding.
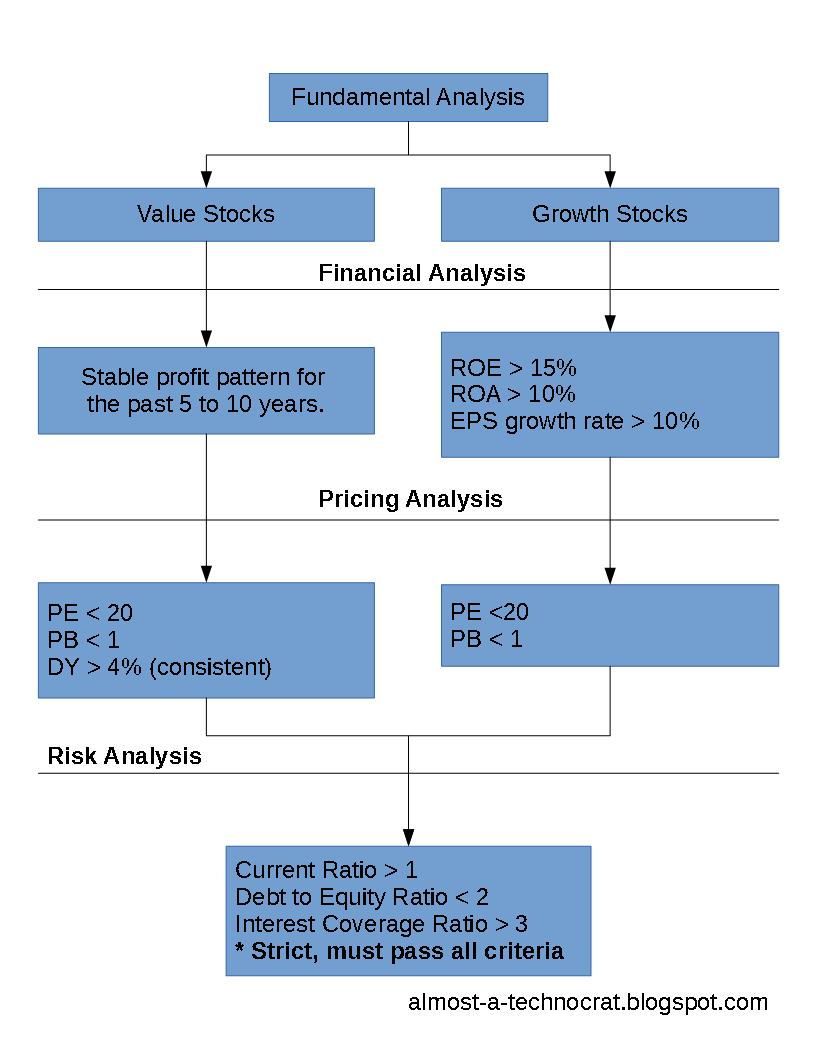
Above is a summary flowchart that I have created based on my understanding after attending the workshop. As I am a still learning about the stock market, I might be wrong so please feel free to comment. I might learn new things from your comments.
Business or Industry Analysis
Investment theme of the year
- Have an investment theme.
- What are some of the investment themes that are interesting this year?
- Look at the repetitive news theme and think of what are the companies that are benefiting from the bad news.
Classifying the stocks
- Value Stocks: Company that has stable profit with stable dividend yield.
- Growth Stocks: Company that has potential for high profit growth.

How to seek value business?
Revenue or profit is expected to be stable for years.How to seek growth business?
- What kind of product or services will be required more or price will continue to increase in the future?
- What will likely happen in 5 to 10 years time?
- Which company will benefit?
- Which company will profit?
Note:
The key to long term investment is to look for business with potential growth in profit over long term ( 5 to 10 years), their share price is very likely to increase and you will pick up dividends along the way.Financial Statement Analysis
- Look at company profit pattern for the past 5 to 10 years.
- Return on Equity (ROE) = Profit / Equity
- For growth stocks, ROE > 15% means the company is conducive for growth.
- For growth stocks, ROE > 15% means the company is conducive for growth.
- Return on Asset (ROA) = Profit / Asset
- For growth stocks, ROA preferably > 10%
Pricing Analysis
The saying "buy low sell high" in stock investments are one of the key to success in getting an optimum returns. Pricing analysis will help to determine if a company stock price is potential undervalued. Buying a well profitable, managed company with an undervalued stock price will almost guarantee a good return from the investment.
Price to earnings ratio (PE)
- PE > 20 is expensive!
- Study the PE and KLCI stocks PE for benchmark.
- Run peer comparison to get a benchmark of lowest PE and highest PE.
- If a growth stock has PE > 20, will need good justifications why buy.
- A quick calculation of fair value using PE.
- Fair value = Avg peer PE x Estimated future earning per share
Price to book value ratio (PB)
- PB > 1 is expensive!
- Book value indicates how much is the company shares worth.
- It is also known as Net Asset Value (NAV)
- NAV = Assets – Liabilities(Loan)
- A collection of assets (Inventories & Machineries)
Dividend yields (DY)
If a Malaysian stock gives DY > 4% consistently is good.Risk Analysis
The idea of running risk analysis on company stocks is to filter out all the risky business whether it is a value or growth stock. Risk analysis involves analysing the company cash flow and it's liabilities to see if the business financials are well balanced. Below are 3 key financial ratios that indicates if a company's assets and it's liabilities are well balanced. As a general rule of thumb, risk analysis must be strict and all 3 ratios criteria must pass for all stocks that are screened.Current ratio
- Current ratio = Current assets / Current liabilities
- Preferably > 1
- Most commonly used as a gauge to determine if company has enough cash to operate the next year.
- If a company has high current ratio, it might mean that the company is not making good use of its cash.
Debt to equity ratio
- Debt to Equity ratio = Total Debt / Total Equity
- How much debt for every dollar of equity.
- More debt will mean:
- Higher risk of company not able to repay loan.
- Greater efficiency as more money for the business.
- Higher risk of company not able to repay loan.
- Preferably < 2
Interest coverage ratio
- Interest coverage ratio = EBIT / Interest Expense
- To measure company’s ability in servicing interest.
- Higher ratio means that the company is better able to cover the loan interest.
- Higher ratio means that the company is better able to cover the loan interest.
- Higher the better, preferably > 3.


Comments
Post a Comment
Thank you for visiting Almost a Technocrat. Due to many spam comments, your comment will be moderated.